Guides · Read your executive results
Read your executive results
What do P25/P50/P75, components, confidence and the peer table mean?
The range. P25, P50 (the median) and P75 are the 25th, 50th and 75th percentiles of total compensation for organizations like yours. The board policy target marker defaults to the median; move it if your board has adopted a different target.
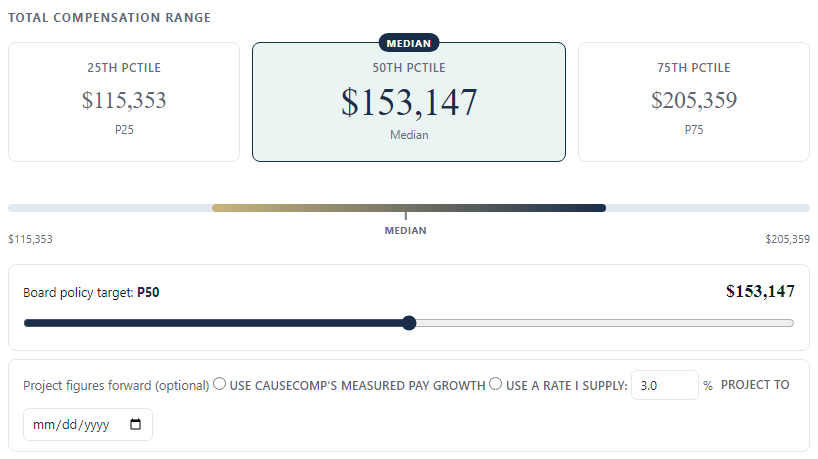
Base salary first. The Schedule J table breaks pay into base salary, bonus, other reportable pay, retirement and deferred pay, and nontaxable benefits. For most nonprofits, base salary is the number that matters most. Each row is calculated on its own, so the rows will not add up to total compensation. That is expected.
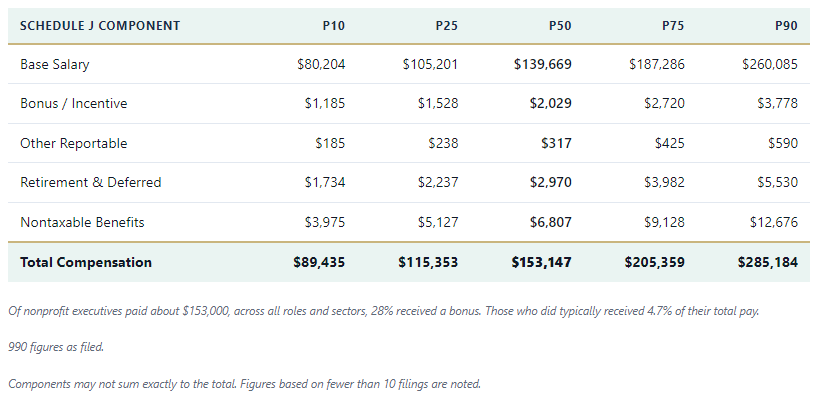
Confidence. This tells you how many Form 990 filings stand behind the figure. It is not a statistical confidence interval. Where a figure rests on fewer than 10 filings, the page says so.
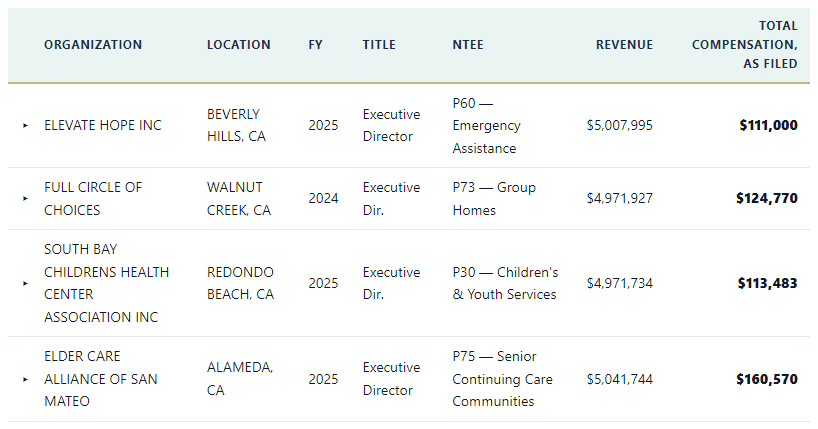
The peer table. These are named organizations and what they reported on their most recent filings. They are drawn separately from the modeled range. Expect some spread: a single peer far above the rest usually reflects a long-tenured or unusually broad role. Look at the pattern, not one row.
Documented comparability data like the above supports — but does not by itself establish — a board's rebuttable presumption of reasonableness under IRC §4958 (intermediate sanctions). The presumption also requires advance approval by an independent board body and contemporaneous documentation. CauseComp provides comparability data for informational purposes and does not provide legal or tax advice.
Still stuck? Email support@causecomp.org